Collector
For collecting metrics and availability from the nodes in this setup we'll make use of Grafana Alloy.
Grafana Alloy is a lightweight agent that can collect telemetry signals in different formats, process them and forward them to different backends.
Initially we'd thought of using Prometheus, Node Exporter and Blackbox Exporter for this, but Alloy can do all-in-one so we'll go with that.
Alloy will be installed on each node
Install Alloy
The install assumes that the Grafana Labs repositories have been configured
sudo apt update
sudo apt install alloy
Configure Alloy
Alloy will have different config based on the type of node, but some config will be generic.
In this setup we'll enable the Alloy UI and the live debugging feature, this is optional
The Alloy config file can be found at sudo vi /etc/alloy/config.alloy and uses the HCL format
By default Alloy is set up to scrape metrics about it self, but lacks a Prometheus forwarding config
The config assumes the different backends (Prometheus and Loki) to be set up on the monitor node
logging {
  level = "warn"
  write_to = [loki.write.os_monitor.receiver]
}

livedebugging {
  enabled = true
}

loki.write "os_monitor" {
  endpoint {
    url = "http://os-monitor.rhmlab.local:3100/loki/api/v1/push"
  }
}

prometheus.exporter.unix "default" {
  include_exporter_metrics = true
  disable_collectors       = ["mdadm"]
}

prometheus.exporter.self "default" {
}

prometheus.scrape "metamonitoring" {
  targets = prometheus.exporter.self.default.targets
  forward_to = [prometheus.remote_write.os_monitor.receiver]
}

prometheus.scrape "unix" {
  targets = prometheus.exporter.unix.default.targets
  forward_to = [prometheus.remote_write.os_monitor.receiver]
}

prometheus.remote_write "os_monitor" {
  endpoint {
    url = "http://os-monitor.rhmlab.local:9090/api/v1/write"
  }
}
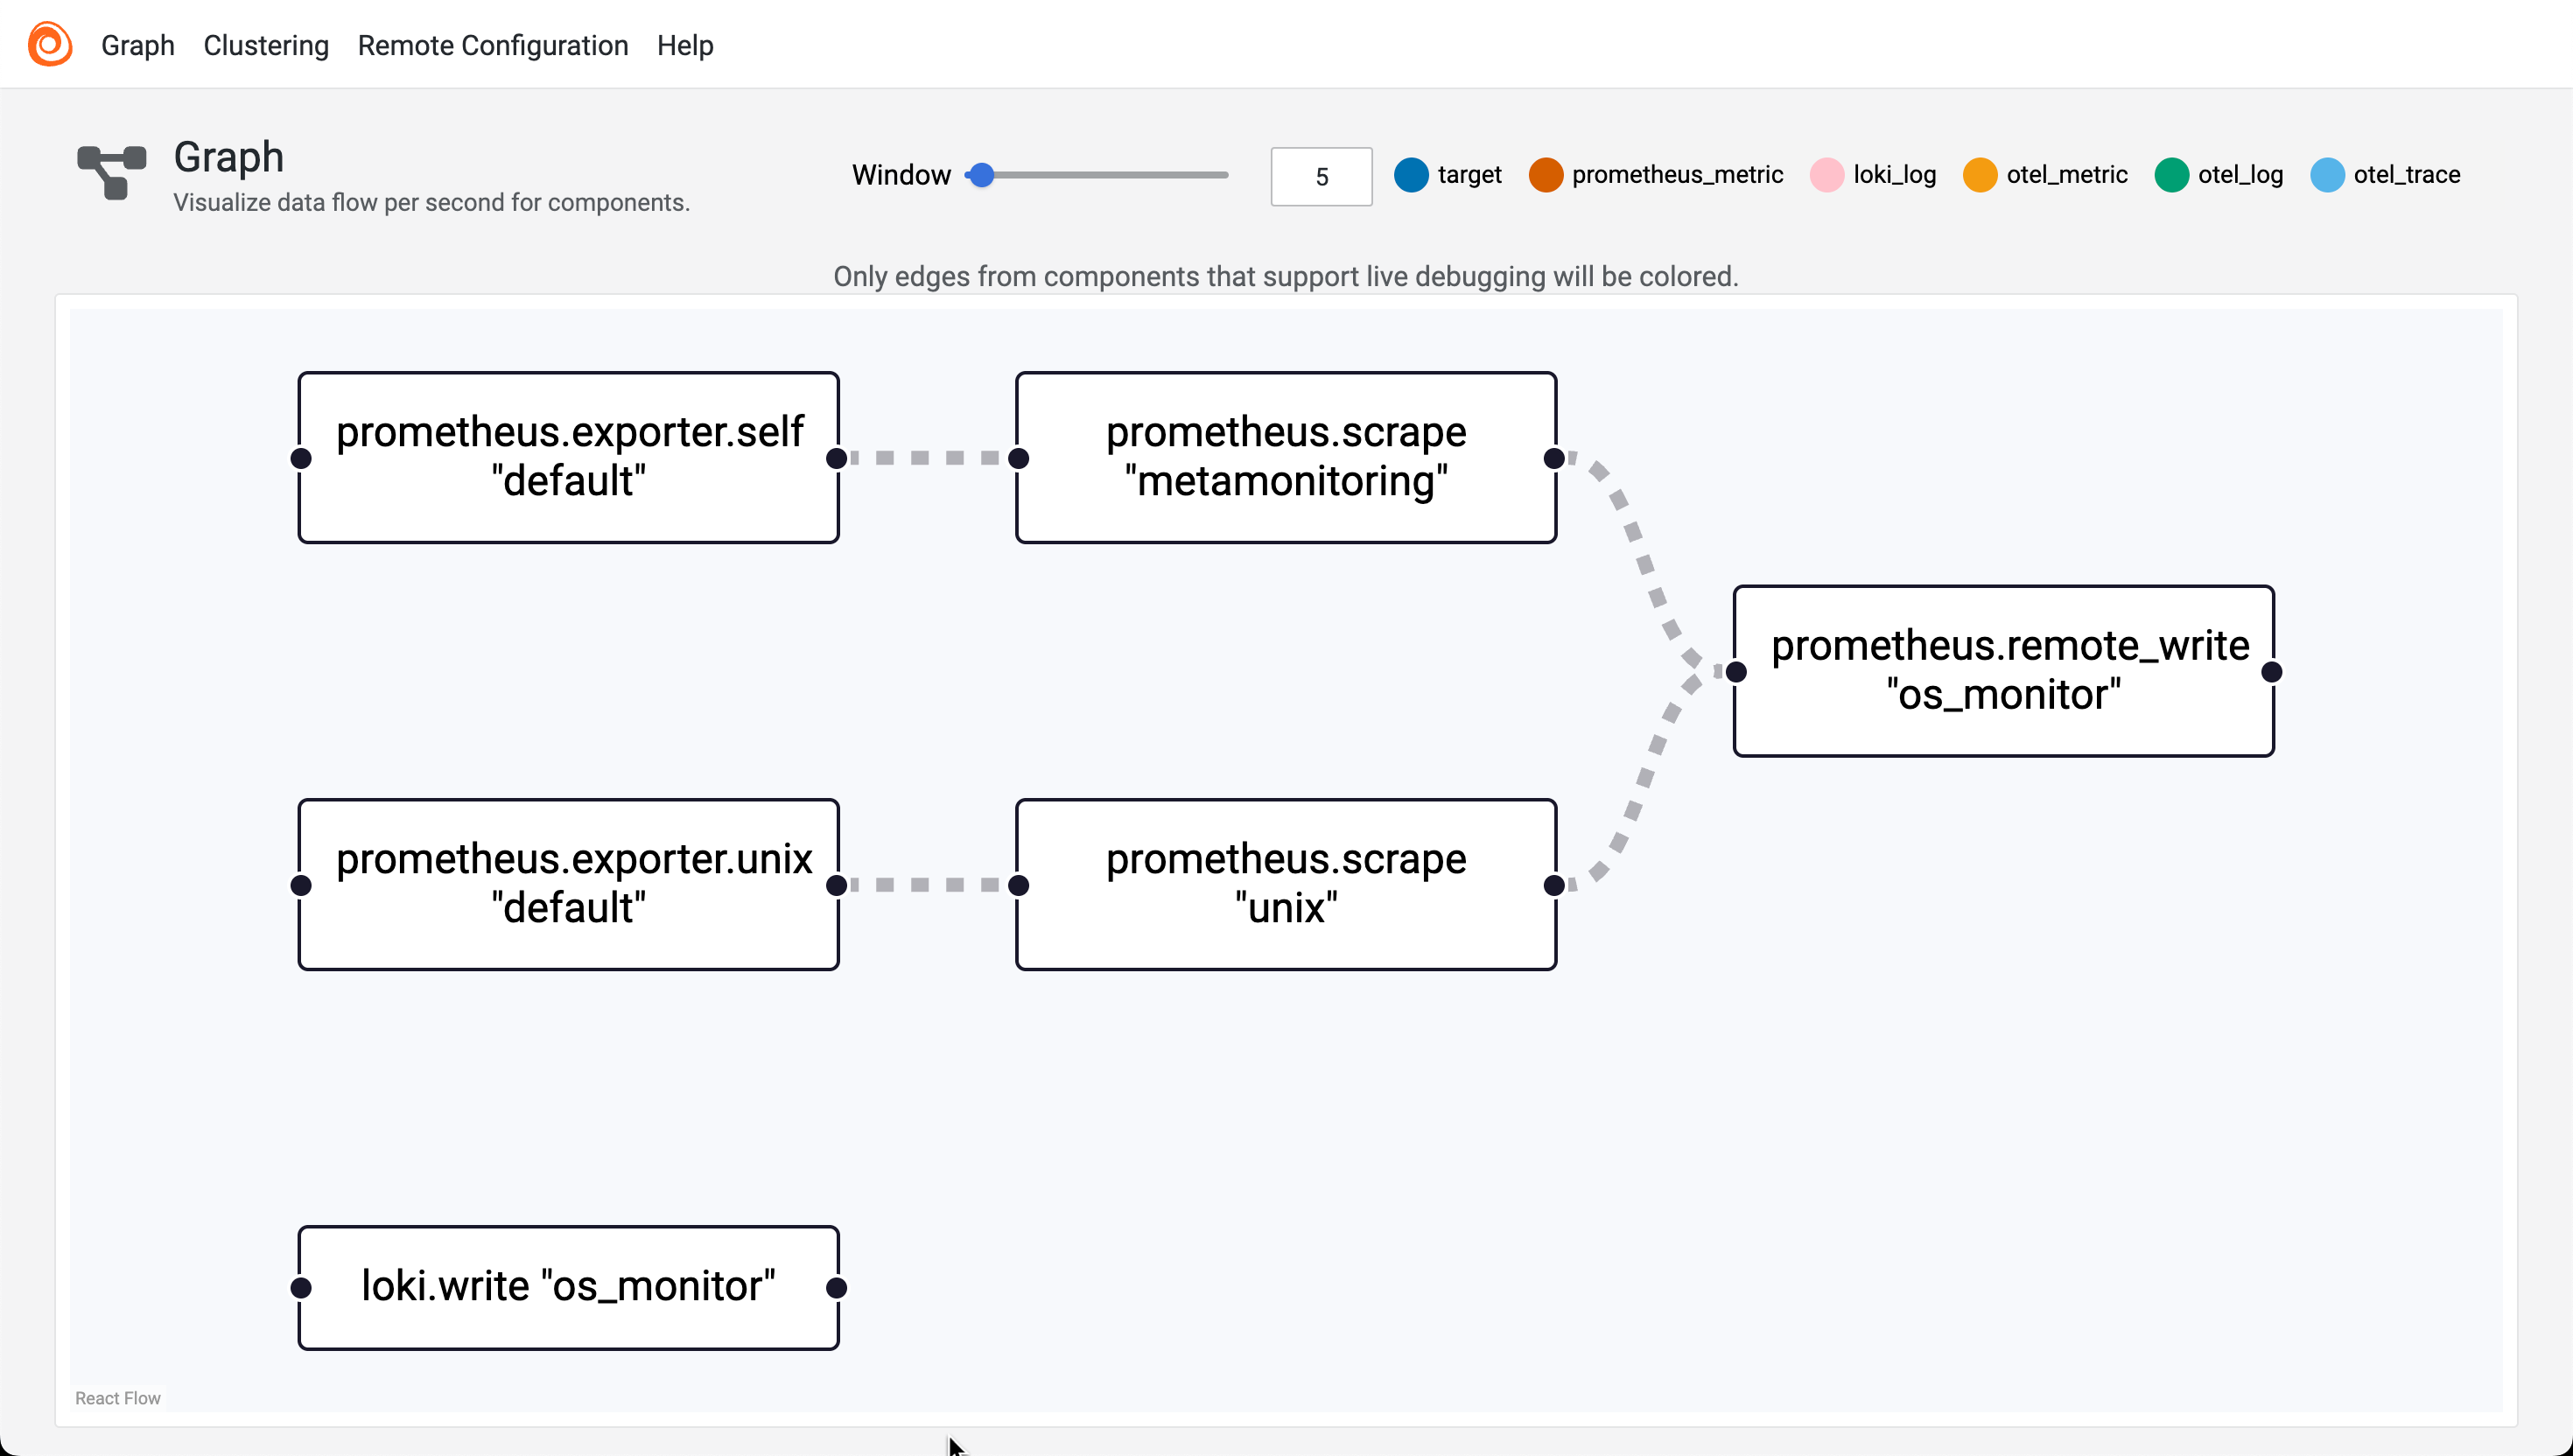
The config above will allow the Alloy collector to scrape metrics about it self and the OS it runs on and forward them to Prometheus, as well as the Alloy logs. For more specific config check the [xyz section]
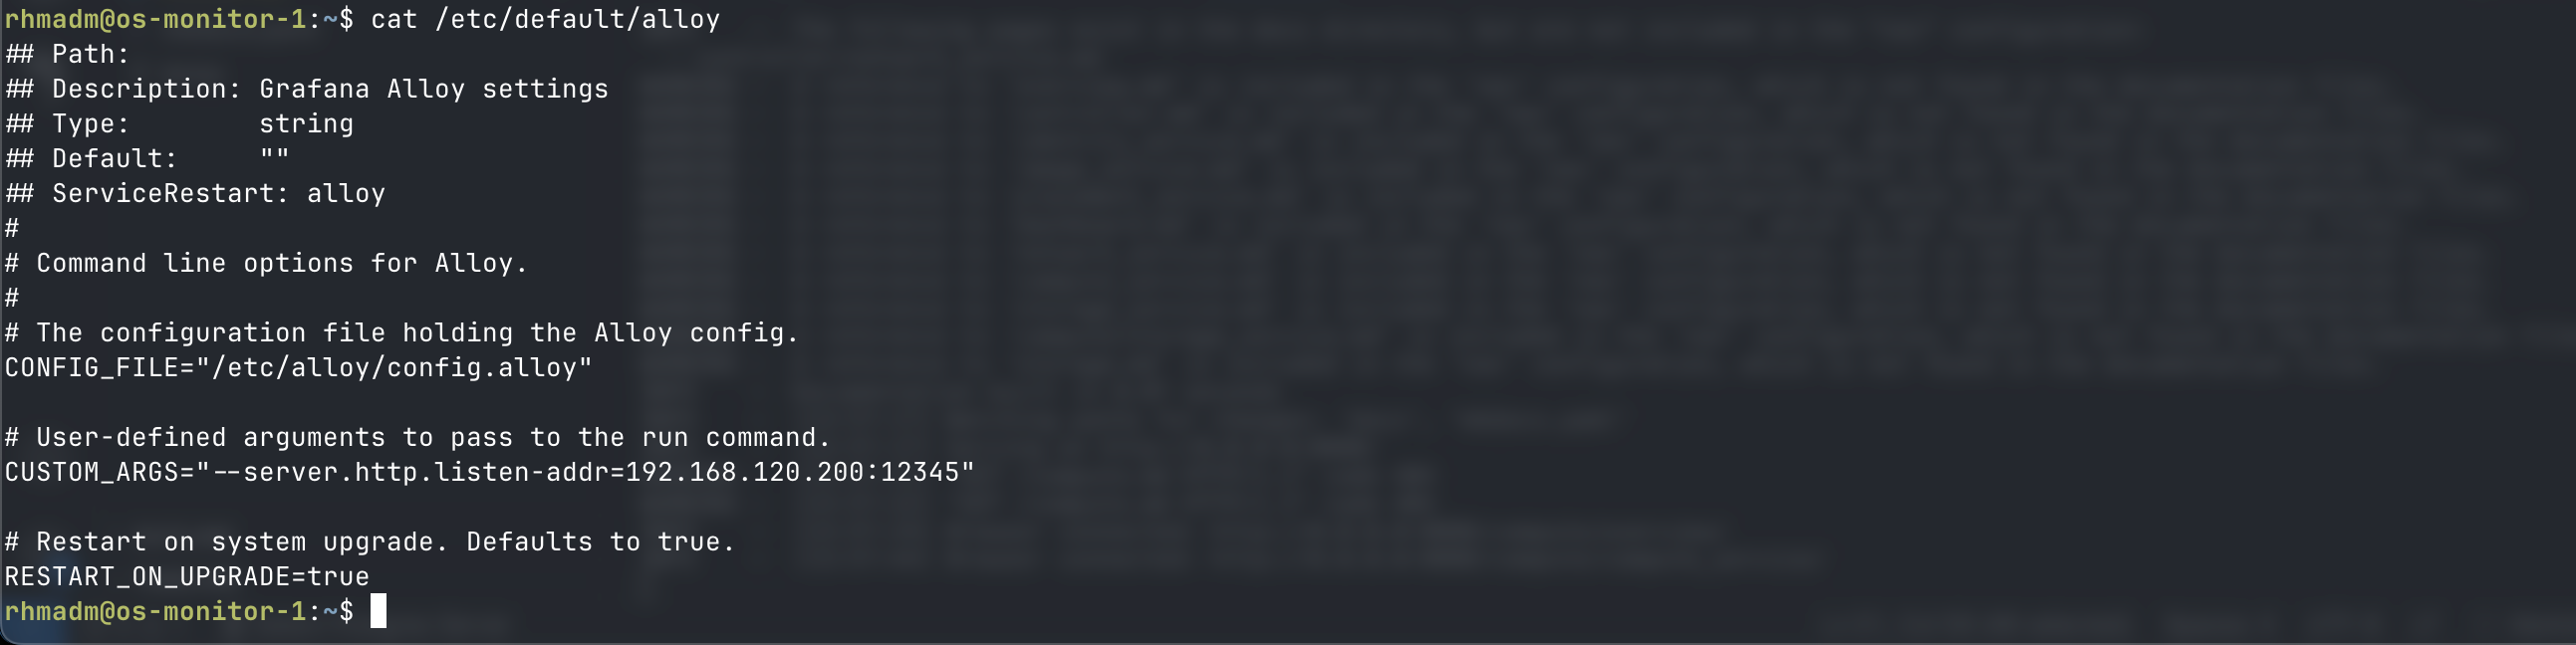
To enable the Alloy UI we'll have to edit the arguments for the binary and add the listen address to CUSTOM_ARGS. This is done in the /etc/defaults/alloy file
## Path:
## Description: Grafana Alloy settings
## Type:        string
## Default:     ""
## ServiceRestart: alloy
#
# Command line options for Alloy.
#
# The configuration file holding the Alloy config.
CONFIG_FILE="/etc/alloy/config.alloy"

# User-defined arguments to pass to the run command.
CUSTOM_ARGS="--server.http.listen-addr=<IP_ADDRESS>:12345"

# Restart on system upgrade. Defaults to true.
RESTART_ON_UPGRADE=true
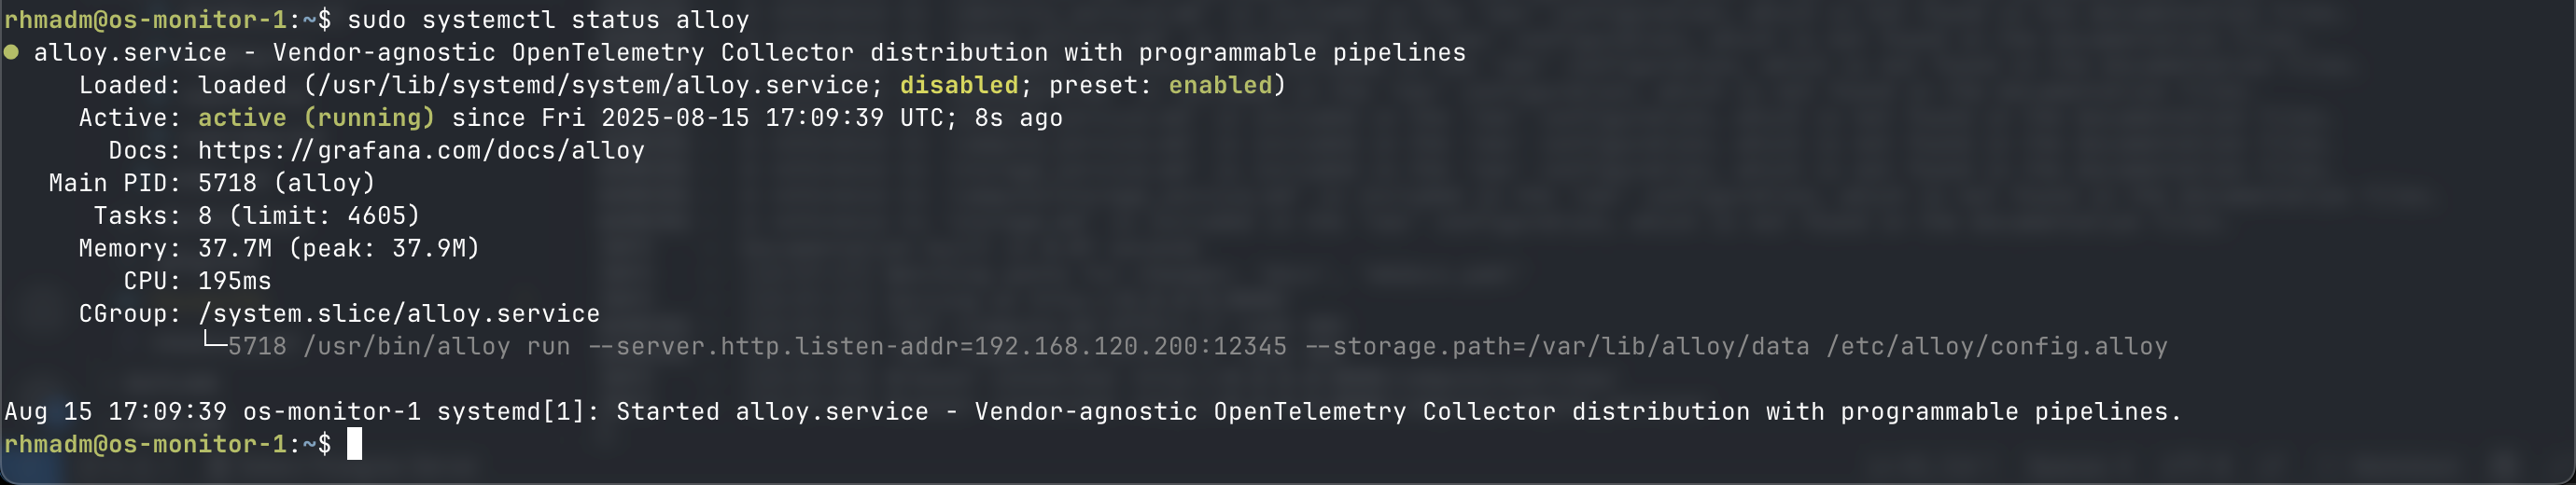
Start and enable Alloy collector
sudo systemctl reload alloy
sudo systemctl start alloy --now
Check Alloy UI
Now we can go to http://
Collector config
journal
Collecting journal logs and forwarding to Loki
loki.source.journal "read" {
  forward_to    = [loki.process.filter.receiver]
  labels        = { component = "loki.source.journal" }
  relabel_rules = loki.relabel.journal.rules
}

loki.relabel "journal" {
  forward_to = []
  rule {
    source_labels = ["__journal__systemd_unit"]
    target_label  = "unit"
  }
}

loki.process "filter" {
  forward_to = [loki.write.os_monitor.receiver]
}

loki.write "os_monitor" {
  endpoint {
    url = "http://os-monitor.rhmlab.local:3100/loki/api/v1/push"
  }
}
Openstack targets - WIP
discovery.openstack "region_ama" {
  region = "RegionAma"
  role = "hypervisor"
  all_tenants = true
  identity_endpoint = "http://os-control:5000/v3"
  username = "admin"
  password = "Passw0rd!"
  domain_name = "Default"
  project_name = "admin"
}

prometheus.scrape "openstack_ama" {
  targets = discovery.openstack.region_ama.targets
  forward_to = [prometheus.remote_write.os_monitor.receiver]
}
File log - openstack
We might have to give the user permissions through the adm group
sudo usermod -aG amd alloy
The Alloy collector pulls log files from the specified directories, processes them and adds a label for service_name based on the filename, adds the hostname as instance and pushes it to Loki.
Note that there's a few labels that Loki will add by default, the
filenamefor instance
local.file_match "openstacklogs" {
    path_targets = [
      {"__path__" = "/var/log/nova/*.log"},
      {"__path__" = "/var/log/neutron/*.log"},
      {"__path__" = "/var/log/keystone/*.log"},
      {"__path__" = "/var/log/glance/*.log"},
      {"__path__" = "/var/log/placement/*.log"}
    ]
}

loki.source.file "openstack_logs" {
  targets = local.file_match.openstacklogs.targets
  forward_to = [loki.process.set_service_from_filename.receiver]
}

loki.process "set_service_from_filename" {
  forward_to = [loki.relabel.files.receiver]
  stage.regex {
    expression = ".*/(?P<service>[^/]+)\\.log$"
    source     = "filename"
  }

   stage.labels {
    values = {
      service_name = "service",
    }
  }
}

loki.relabel "files" {
  forward_to = [loki.write.os_monitor.receiver]
  rule {
    target_label = "instance"
    replacement = constants.hostname
  }
}