Logging
As the logging backend we'll make use of Grafana Loki.
As mentioned we'll have Grafana Alloy as a collector on all nodes, and we'll instruct Alloy to forward logs to the Loki instance
Install Loki
The commands assume that the Grafana Labs repository has been configured
sudo apt update
sudo apt install loki
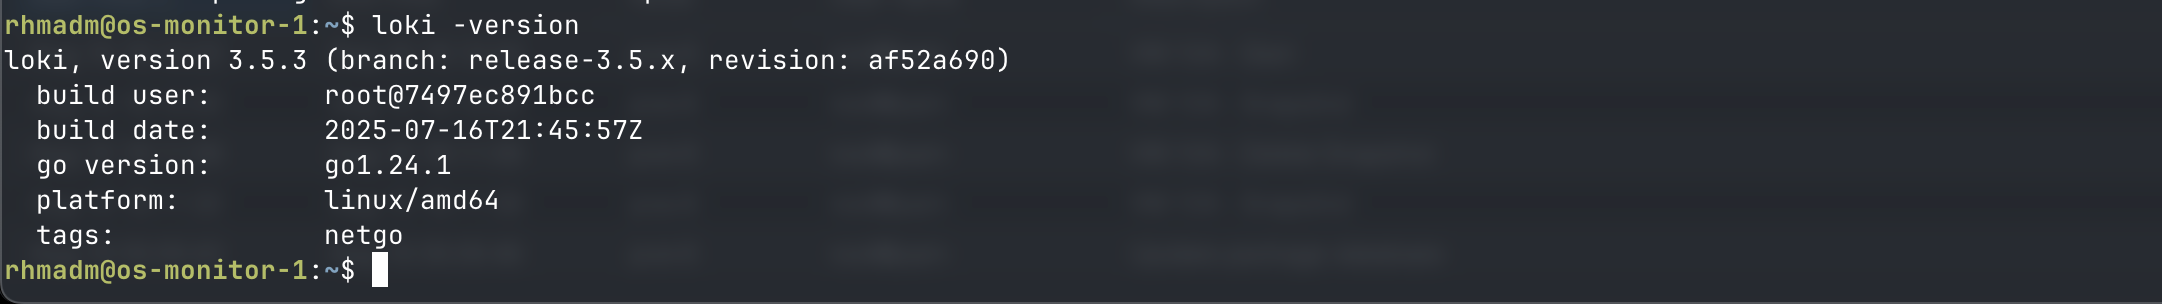
After installing Loki verify the version
Loki error message
Loki might throw this error at start up
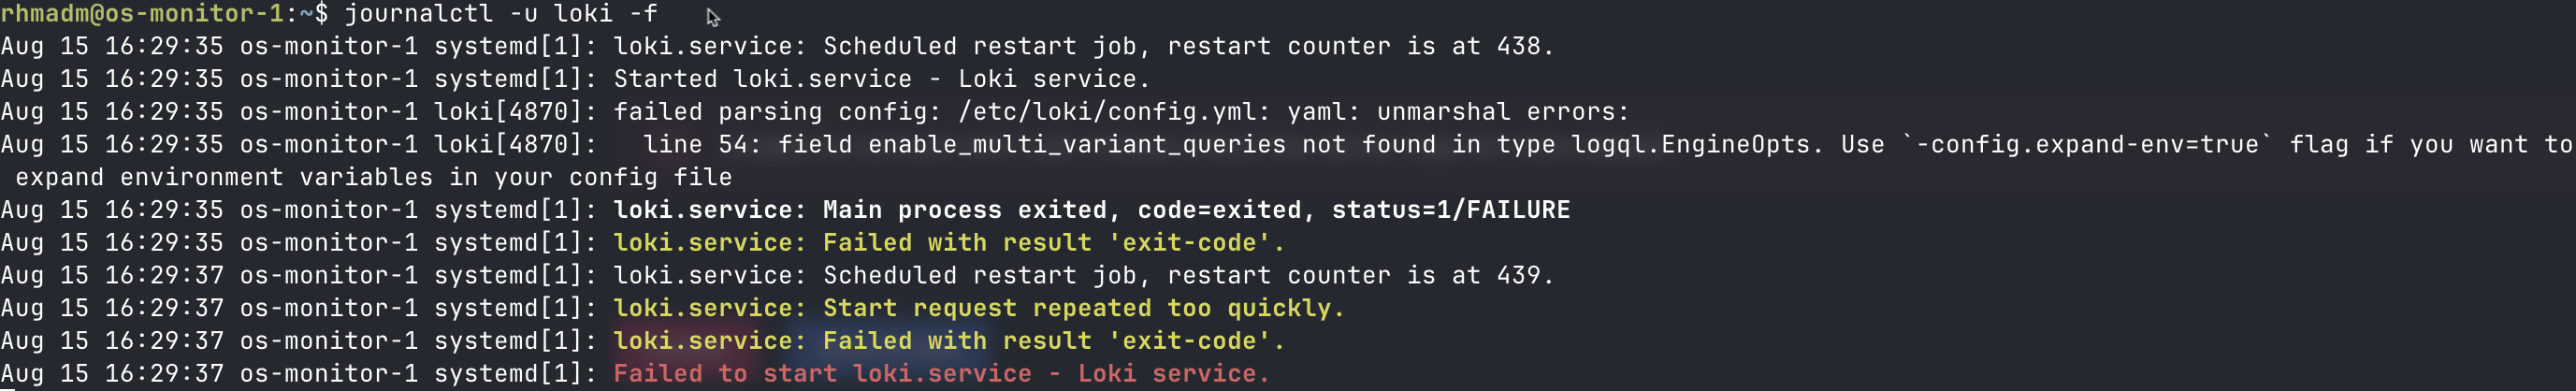
This error is for an experimental feature so we'll remove it in the config file /etc/loki/config.yml
querier:
  engine:
    #enable_multi_variant_queries: false
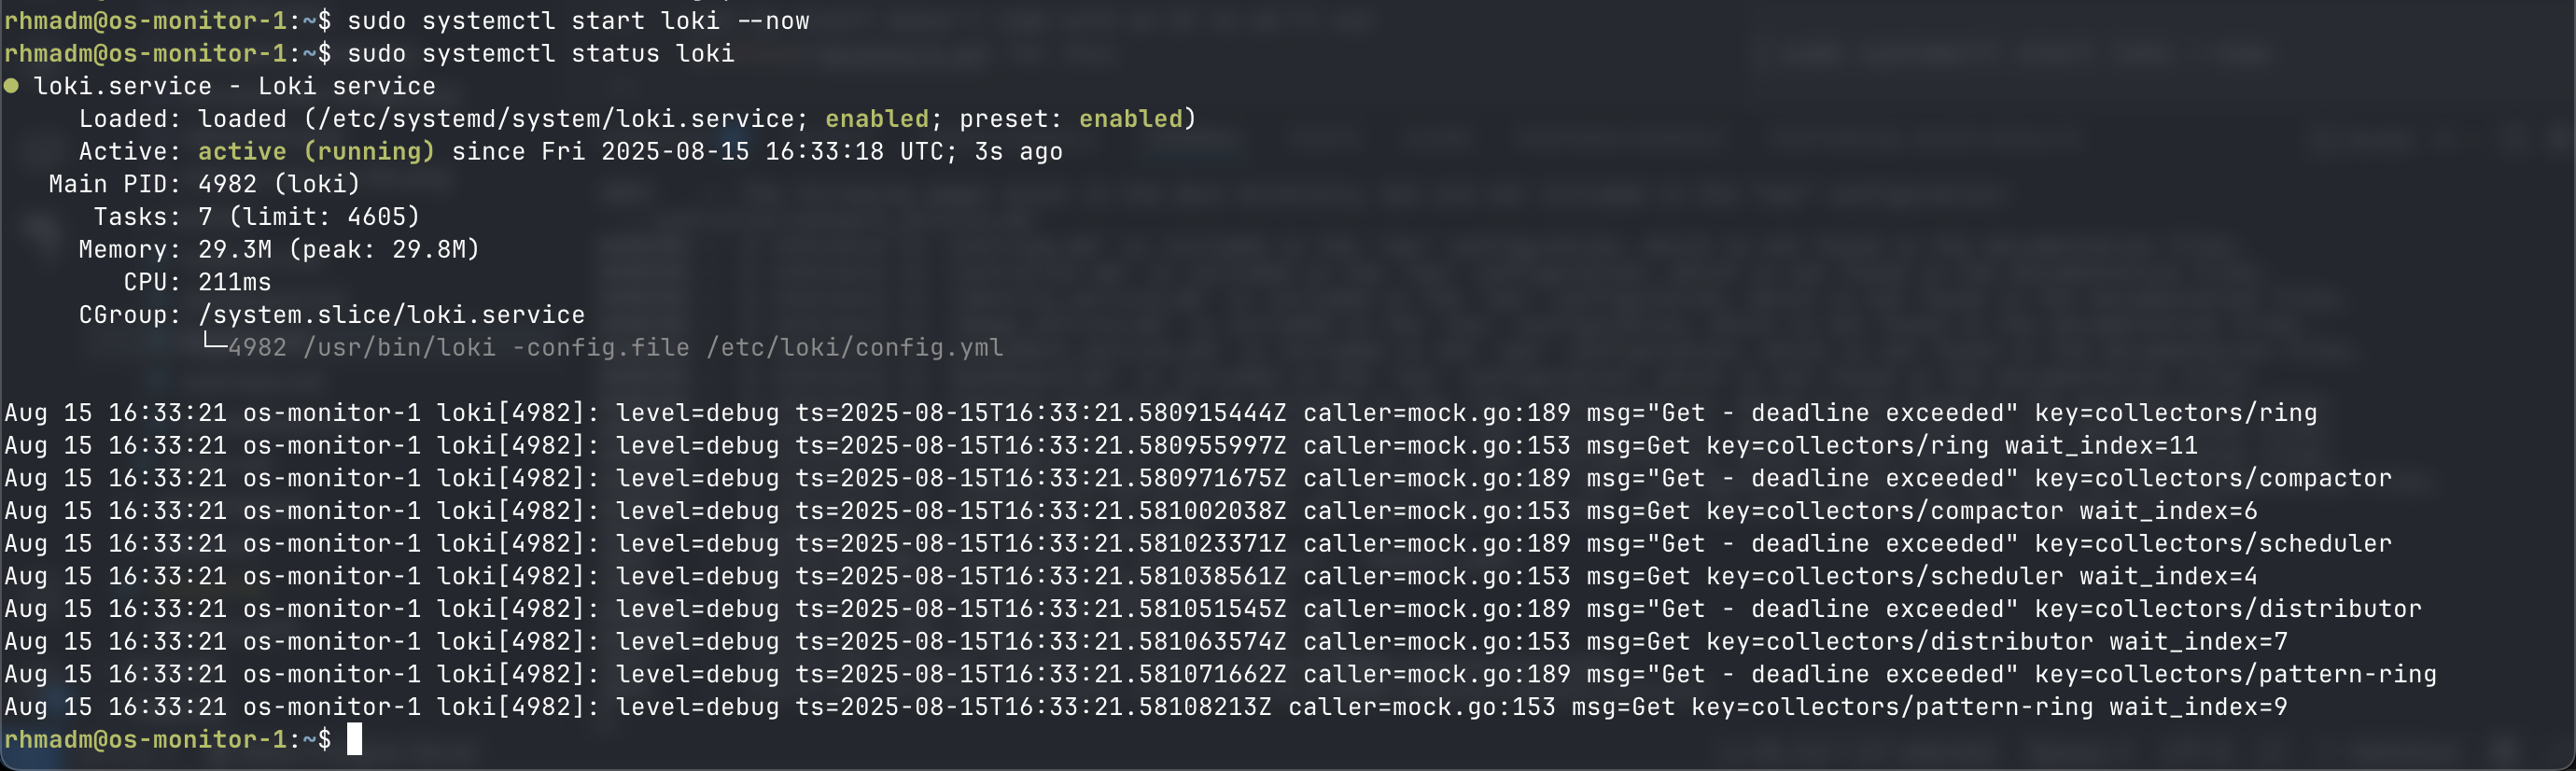
Start and enable Loki service
Ensure that Loki is running
sudo systemctl start loki --now
Visualize logs
Add Loki as datasource in Grafana
Loki by itself doesn't come with an UI so we'll use Grafana for this
In Grafana we'll go to Connectiona -> Data sources and Add data source
Here we'll select Loki, and since we're running Loki on the same server as Grafana we'll use http://localhost:3100 as the URL
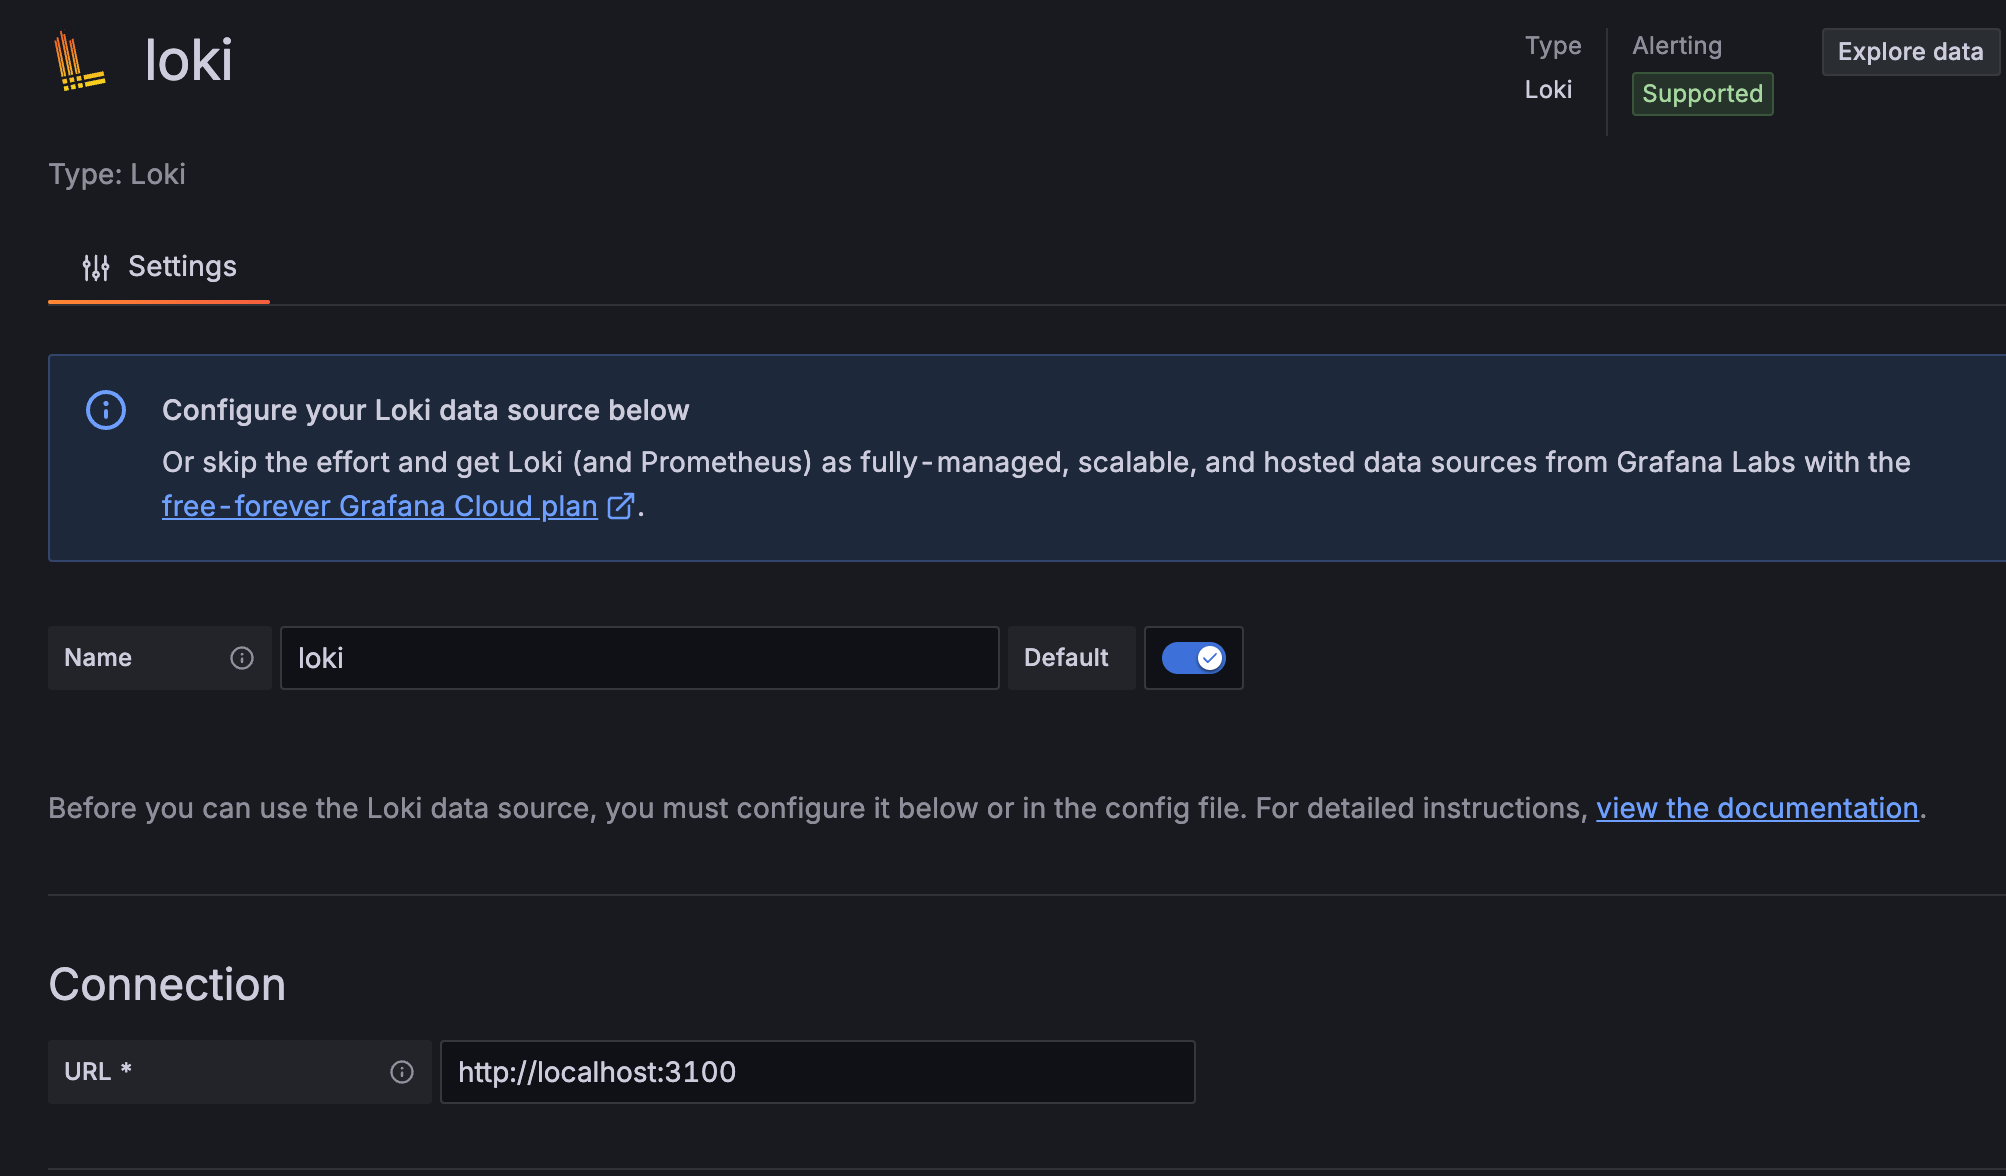
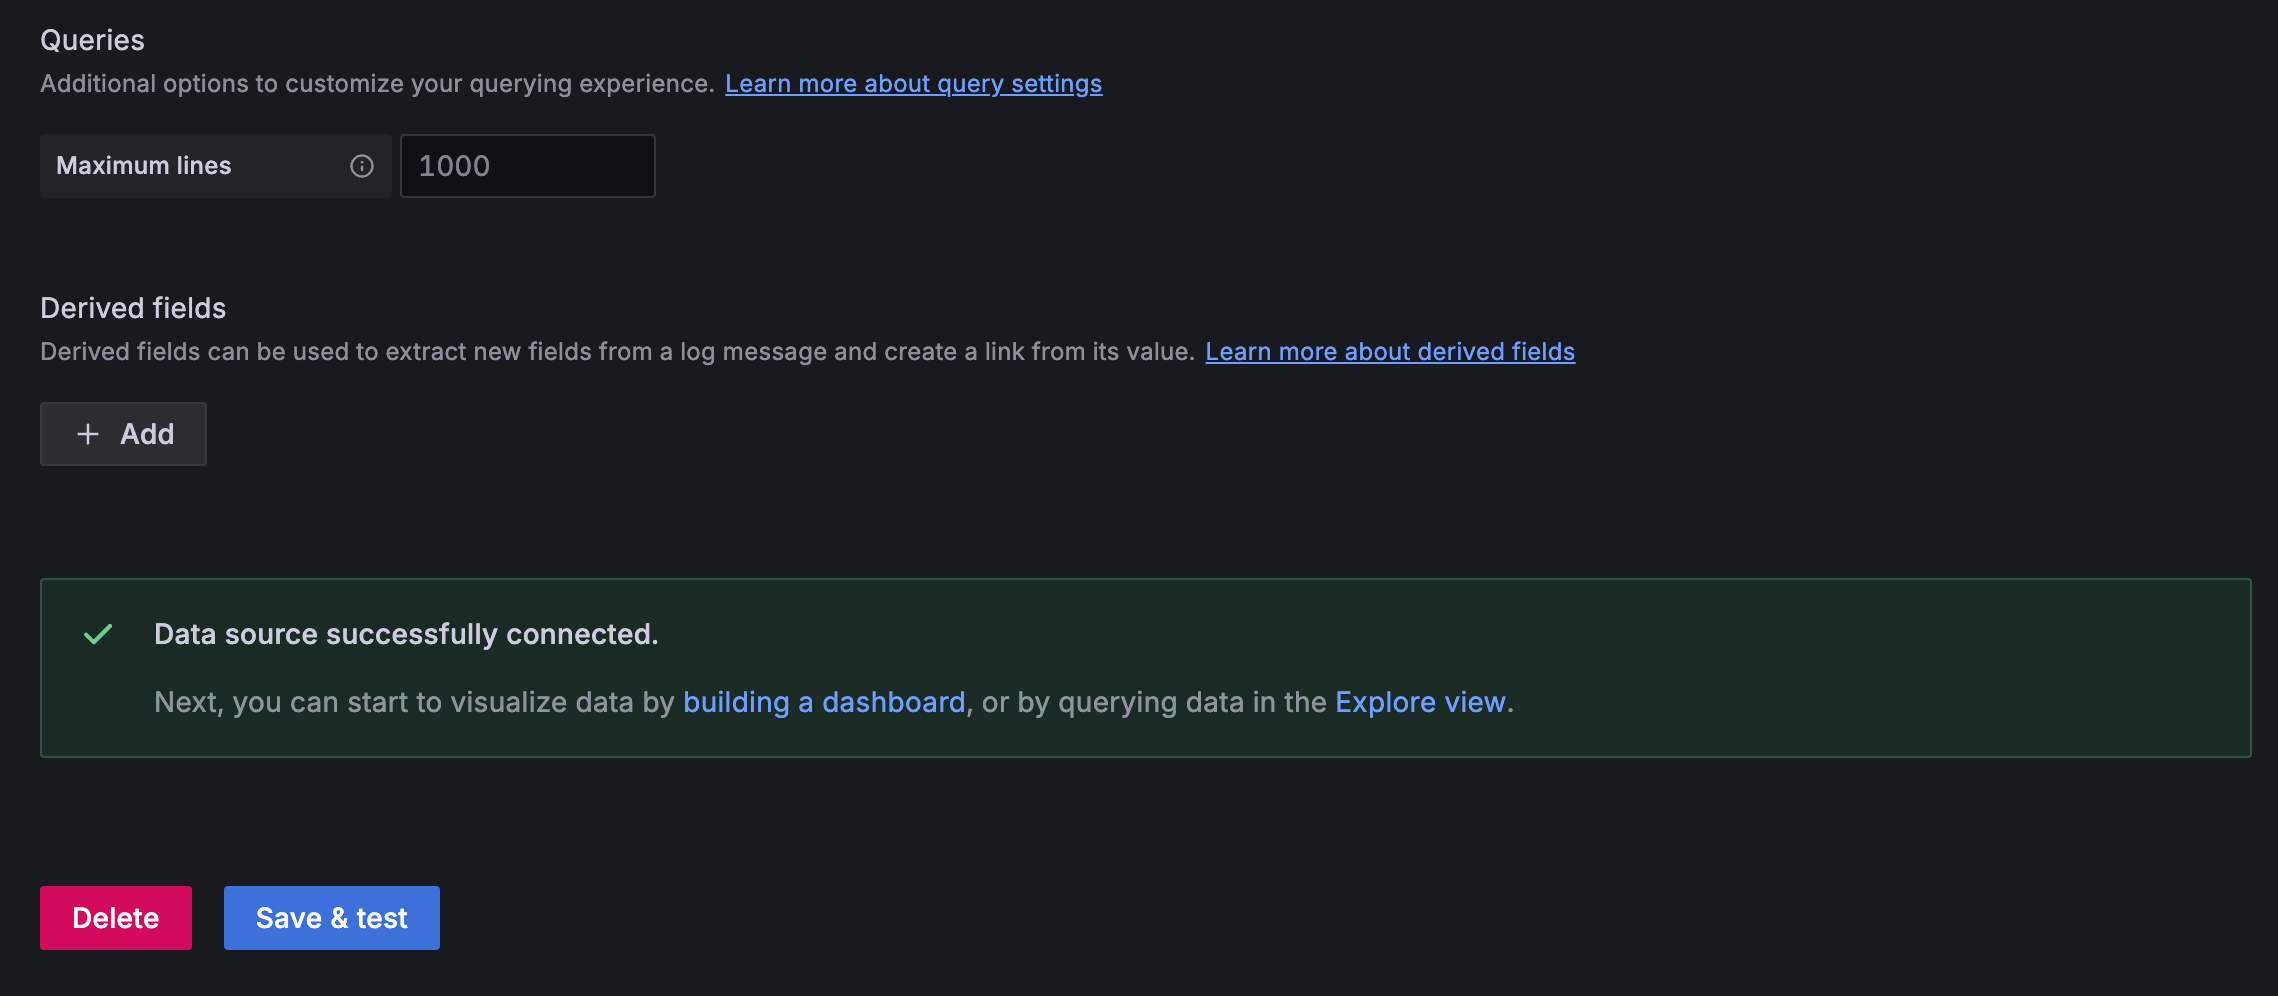
Be sure to Save and Test the configuration
Explore logs
In the Grafana Drilldown feature we can check out our Logs
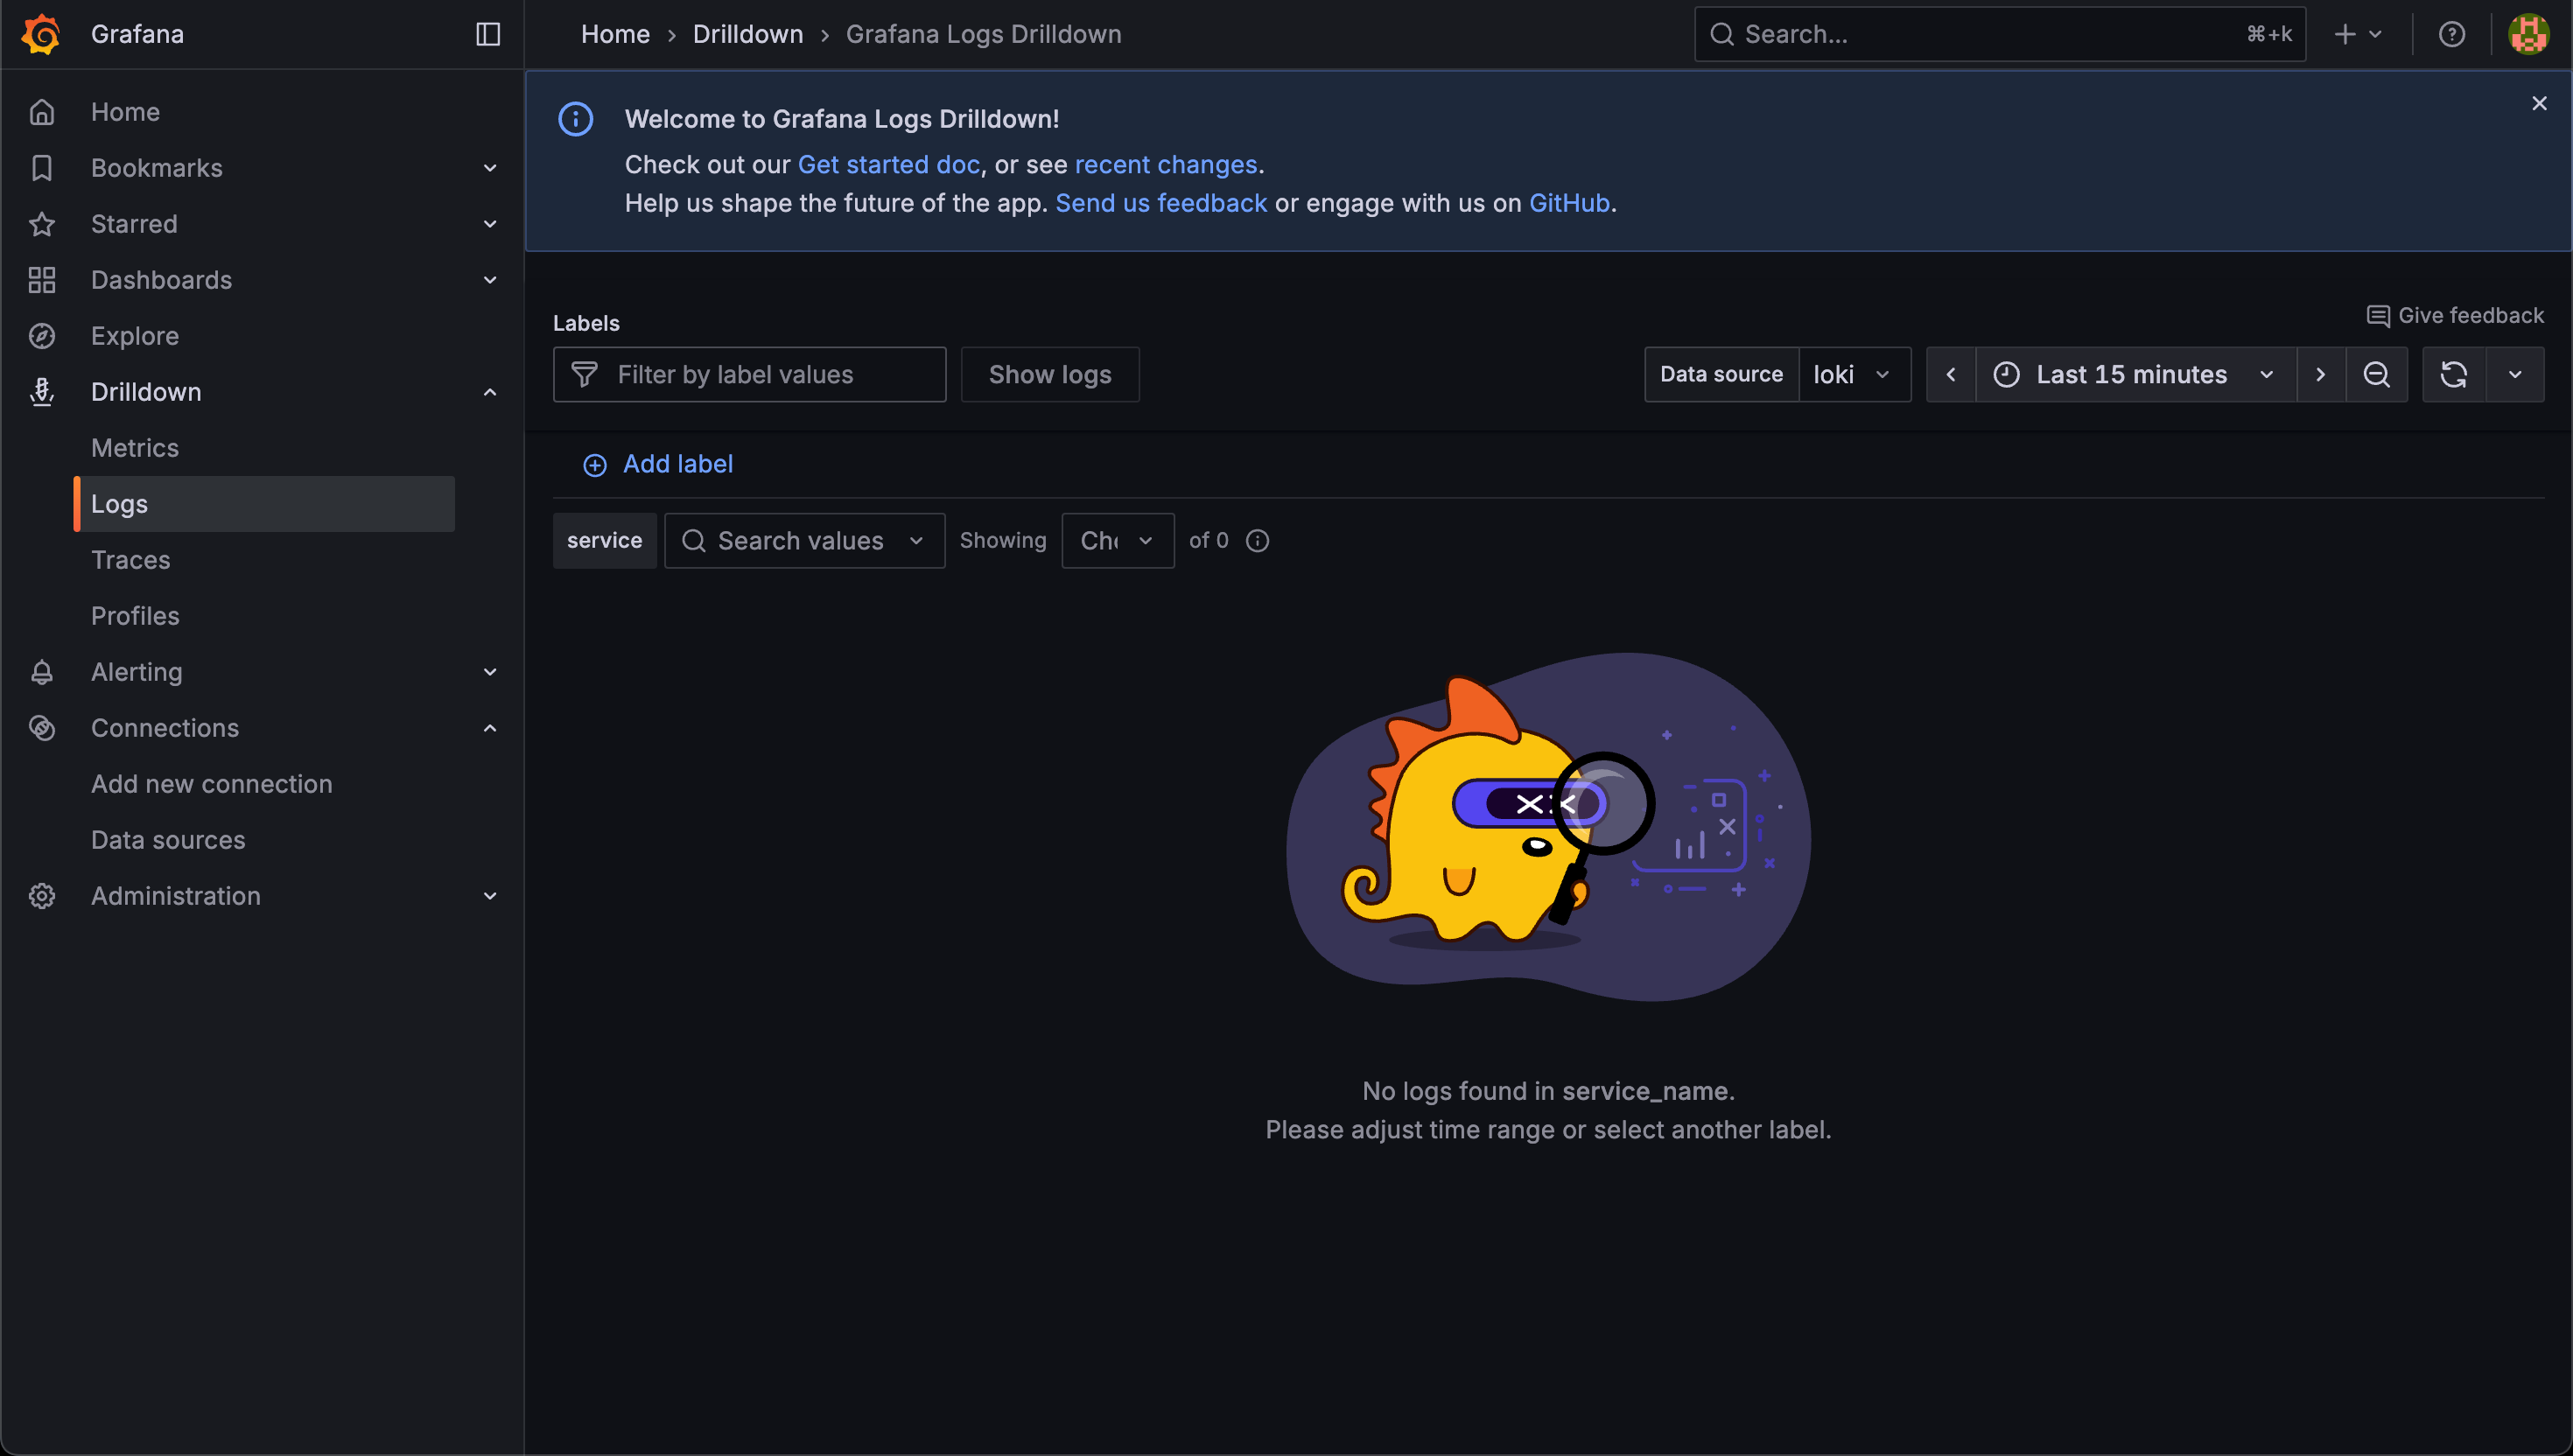
Depending on where we are in the deployment of the monitoring components we might not have any logs to explore at this point